Followers

Showing posts with label SOA BPEL. Show all posts

Monday, April 27, 2015

Enable coherence for SOA Servers

Please follow the below steps to enable coherence for SOA Servers.

ms01- 

hostname=soaserver1.us.com
portnumber=50561

ms02- 

hostname=soaserver2.us.com
portnumber=50562

Please add the fololwoiing enttires into server start arugemtns 

ms01--> configuration --> ServerStart --> Arguments 


ms01 

-Dtangosol.coherence.wka1=soaserver1.us.com -Dtangosol.coherence.wka2=soaserver2.us.com -Dtangosol.coherence.localhost=soaserver1.us.com -Dtangosol.coherence.wka1.port=50561 -Dtangosol.coherence.wka2.port=50562 -Dtangosol.coherence.localport=50561 -Dtangosol.coherence.log=/opt/domains/soa_domain/coherence_ms01.log -Dtangosol.coherence.log.level=9 

ms02--> configuration --> ServerStart --> Arguments 

ms02 

-Dtangosol.coherence.wka1=soaserver1.us.com -Dtangosol.coherence.wka2=soaserver2.us.com -Dtangosol.coherence.localhost=soaserver2.us.com -Dtangosol.coherence.wka1.port=50561 -Dtangosol.coherence.wka2.port=50562 -Dtangosol.coherence.localport=50561 -Dtangosol.coherence.log=/opt/domains/soa_domain/coherence_ms02.log -Dtangosol.coherence.log.level=9 

Thursday, January 15, 2015

Oracle Fusion Middleware: Undeploy the composite When soa_infra in down

Oracle Fusion Middleware: Undeploy the composite When soa_infra in down: Check the SOA logs and determine which composite is causing the problem and then follow the below process to undeploy the composite by edit...

Undeploy the composite When soa_infra in down

Check the SOA logs and determine which composite is causing the problem and then follow the below process to undeploy the composite by editing deployed-composites.xml:

1. Download and copy the ShareSoaInfraPartition.ear file to $MIDDLEWARE_HOME/oracle_common/common/bin

2. cd to $MIDDLEWARE_HOME/oracle_common/common/bin

and

run wlst.sh

3.

connect('weblogic','weblogic1','t3://localhost:7001')


provide the username, password and server URL

4. run the below command to deploy ShareSoaInfraPartition.ear

deploy('ShareSoaInfraPartition','ShareSoaInfraPartition.ear',upload='true')


5. Now run the below command by changing the "toLocation" ('/fmw11g/fmw1115/Middleware' is some location path on SOA machine)

exportMetadata(application='ShareSoaInfraPartition',server='AdminServer',toLocation='/fmw11g/fmw1115/Middleware',docs='/deployed-composites/deployed-composites.xml')


6. A deployed-composites folder will be created at "toLocation" path with deployed-composites.xml in it

7. Delete the composite which is causing the problem and save the file

For example, the MediatorTest composite:

<composite-series name="default/MediatorTest" default="default/MediatorTest!1.0">
<composite-revision dn="default/MediatorTest!1.0" state="on" mode="active" location="dc/soa_58b98be8-9ec8-41af-bb83-590f6004d1aa">
<composite dn="default/MediatorTest!1.0*soa_58b98be8-9ec8-41af-bb83-590f6004d1aa" deployedTime="2011-11-17T09:01:54.750+05:30"/>


8. Now run the below command by changing the "fromLocation" (this should be the same location as previous)

importMetadata(application='ShareSoaInfraPartition',server='AdminServer',fromLocation='/fmw11g/fmw1115/Middleware',docs='/deployed-composites/deployed-composites.xml')


9. Now bounce your server and the composite will not be deployed by SOA when it comes up and hence that should bring your soa-infra up.

Friday, February 28, 2014

Configuring BPEL Process Service Engine Properties

we can configure BPEL process service engine properties, which are used by the BPEL process service engine during processing of BPEL service components.
To configure BPEL process service engine properties:
  1. Access this page through one of the following options:
    From the SOA Infrastructure Menu... From the SOA Folder in the Navigator...
    1. Select SOA Administration > BPEL Properties.
    1. Right-click soa-infra.
    2. Select SOA Administration > BPEL Properties.
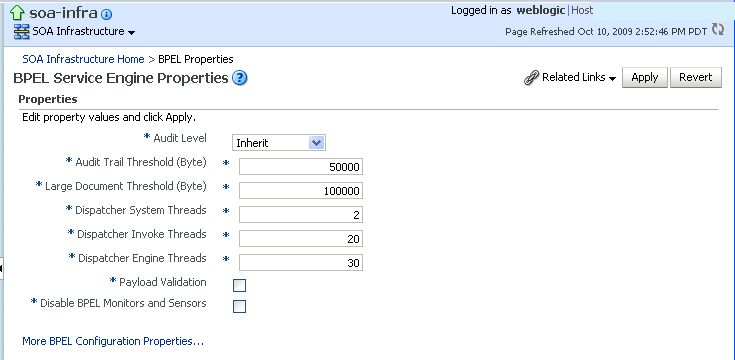
    The BPEL Service Engine Properties page displays properties for setting audit trail and large document thresholds, setting dispatcher thread properties, validating payload schema, and setting the audit trail level.
    Description of soaadmin_bpel_props.gif follows
    Description of the illustration soaadmin_bpel_props.gif
  2. Make changes to the service engine properties that are appropriate to your environment.
    Property Description
    Audit Level Select one of the following options:
    • Off: Composite instance tracking and payload tracking information is not collected.
    • Inherit: Logging equals the SOA Infrastructure audit level. This setting enables the BPEL audit level to automatically change when the global setting is changed. Setting a different audit level tracking in this page overrides the tracking set at the SOA Infrastructure level.
    • Minimal: The BPEL service engine does not capture any audit details. Therefore, they are not available in the flow audit trails. All other events are logged.
    • Production: The BPEL service engine does not capture the payload. The payload details are not available in the flow audit trails. Payload details for other BPEL activities are collected, except for assign activities. This level is optimal for most standard operations and testing.
    • Development: Allows both composite instance tracking and payload tracking. All events are logged. However, it may have an impact on performance. This level is useful mostly for debugging purposes.
    Audit Trail Threshold Enter the maximum size in bytes of an instance audit trail before it is chunked and saved in a dehydration store table separate from the audit trail. If the threshold is exceeded, the View XML link is shown in the audit trail instead of the payload.
    Large Document Threshold Enter the maximum size of a generated document within a BPEL process component instance before it is stored in a separate table in the dehydration store.
    Dispatcher System Threads Specify the total number of threads allocated to process system dispatcher messages. System dispatcher messages are general cleanup tasks that are typically processed quickly by the server (for example, releasing stateful message beans back to the pool). Typically, only a small number of threads are required to handle the number of system dispatch messages generated during runtime. The default value is 2 threads. Any value less than 1 thread is changed to the default.
    Dispatcher Invoke Threads Specify the total number of threads allocated to process invocation dispatcher messages. Invocation dispatcher messages are generated for each payload received and are meant to instantiate a new instance. If the majority of requests processed by the service engine are instance invocations (as opposed to instance callbacks), greater performance may be achieved by increasing the number of invocation threads. Higher thread counts may cause greater CPU utilization due to higher context switching costs. The default value is 20 threads. Any value less than 1 thread is changed to the default.
    Dispatcher Engine Threads Specify the total number of threads allocated to process engine dispatcher messages. Engine dispatcher messages are generated whenever an activity must be processed asynchronously. If most of the processes deployed are durable with a large number of dehydration points (midprocess receive, onMessage, onAlarm, and wait activities), greater performance may be achieved by increasing the number of dispatcher engine threads. Note that higher thread counts can cause greater CPU utilization due to higher context-switching costs. The default value is 30 threads. Any value less than 1 thread is changed to the default.
    Payload Validation Select to enable validation of inbound and outbound messages. Nonschema-compliant payload data is intercepted and displayed as a fault. Note: This setting is independent of the SOA composite application and SOA Infrastructure payload validation level settings. If payload validation is enabled at both the service engine and SOA Infrastructure levels, data is checked twice: once when it enters the SOA Infrastructure, and again when it enters the service engine.
    Disable BPEL Monitors and Sensors Select this checkbox to disable all BPEL monitors and sensors defined for all BPEL components across all deployed SOA composite applications.
  3. Click Apply.
  4. If you want to configure advanced BPEL properties in the System MBean Browser, click More BPEL Configuration Properties. Properties that display include, but are not limited to, the following. Descriptions are provided for each property.
    • BpelcClasspath: The extra BPEL class path to include when compiling BPEL-generated Java sources.
    • DisableAsserts: Disables the execution of assertions in BPEL, including the bpelx:assert activity.
    • DisableSensors: Disables all calls to sensors.
    • ExpirationMaxRetry: The maximum number of times a failed expiration call (wait/onAlarm) is retried before failing.
    • ExpirationRetryDelay: The delay between expiration retries.
    • InstanceKeyBlockSize: The size of the block of instance IDs to allocate from the dehydration store during each fetch.
    • MaximumNumberOfInvokeMessagesInCache: The number of invoke messages stored in in-memory cache.
    • MaxRecoverAttempt: The number of automatic recovery attempts to submit in the same recoverable instance.
    • OneWayDeliveryPolicy: Changes whether one-way invocation messages are delivered.
    • StatsLastN: The size of the most recently processed request list.
    • SyncMaxWaitTime: The maximum time a request and response operation takes before timing out.
  5. Make changes appropriate to your environment.

Dehydration Store Monitoring

Dehydration Store Monitoring

The dehydration store monitoring feature allows you to see the performance of the database instance relevant to the SOA Infrastructure. Using this data, the SOA administrator can identify problems that are causing the performance bottleneck.

Setting Up and Viewing the Dehydration Diagnostics Data

Before you can view the dehydration diagnostics data, ensure that:
  • The database has been configured and is available as a target in Enterprise Manager.
  • The SOA Repository properties have been specified in the Monitoring Configuration page.
To view the dehydration diagnostics data, follow these steps:
  1. Log into Enterprise Manager Cloud Control.
  2. Click a SOA Infrastructure target on the Middleware page.
  3. In the SOA Infrastructure Home page, click the Dehydration Store tab.
  4. The following details area displayed:
    • Throughput indicators that provide details of the general health of the database instance.
    • Wait bottleneck issues related to the CPU, I/O, and Wait events.
    • Tablespace utilization for the SOA schema.
    • Performance data recorded by the ASH.
    • Key SOA tables and tablespace details related to the SOA schema.