Followers

Friday, February 28, 2014

Configuring BPEL Process Service Engine Properties

we can configure BPEL process service engine properties, which are used by the BPEL process service engine during processing of BPEL service components.
To configure BPEL process service engine properties:
  1. Access this page through one of the following options:
    From the SOA Infrastructure Menu... From the SOA Folder in the Navigator...
    1. Select SOA Administration > BPEL Properties.
    1. Right-click soa-infra.
    2. Select SOA Administration > BPEL Properties.
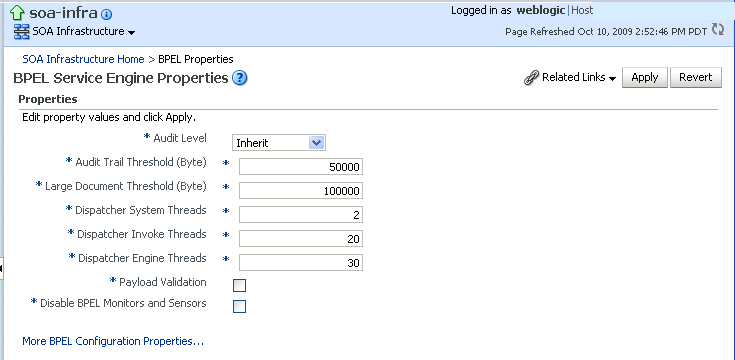
    The BPEL Service Engine Properties page displays properties for setting audit trail and large document thresholds, setting dispatcher thread properties, validating payload schema, and setting the audit trail level.
    Description of soaadmin_bpel_props.gif follows
    Description of the illustration soaadmin_bpel_props.gif
  2. Make changes to the service engine properties that are appropriate to your environment.
    Property Description
    Audit Level Select one of the following options:
    • Off: Composite instance tracking and payload tracking information is not collected.
    • Inherit: Logging equals the SOA Infrastructure audit level. This setting enables the BPEL audit level to automatically change when the global setting is changed. Setting a different audit level tracking in this page overrides the tracking set at the SOA Infrastructure level.
    • Minimal: The BPEL service engine does not capture any audit details. Therefore, they are not available in the flow audit trails. All other events are logged.
    • Production: The BPEL service engine does not capture the payload. The payload details are not available in the flow audit trails. Payload details for other BPEL activities are collected, except for assign activities. This level is optimal for most standard operations and testing.
    • Development: Allows both composite instance tracking and payload tracking. All events are logged. However, it may have an impact on performance. This level is useful mostly for debugging purposes.
    Audit Trail Threshold Enter the maximum size in bytes of an instance audit trail before it is chunked and saved in a dehydration store table separate from the audit trail. If the threshold is exceeded, the View XML link is shown in the audit trail instead of the payload.
    Large Document Threshold Enter the maximum size of a generated document within a BPEL process component instance before it is stored in a separate table in the dehydration store.
    Dispatcher System Threads Specify the total number of threads allocated to process system dispatcher messages. System dispatcher messages are general cleanup tasks that are typically processed quickly by the server (for example, releasing stateful message beans back to the pool). Typically, only a small number of threads are required to handle the number of system dispatch messages generated during runtime. The default value is 2 threads. Any value less than 1 thread is changed to the default.
    Dispatcher Invoke Threads Specify the total number of threads allocated to process invocation dispatcher messages. Invocation dispatcher messages are generated for each payload received and are meant to instantiate a new instance. If the majority of requests processed by the service engine are instance invocations (as opposed to instance callbacks), greater performance may be achieved by increasing the number of invocation threads. Higher thread counts may cause greater CPU utilization due to higher context switching costs. The default value is 20 threads. Any value less than 1 thread is changed to the default.
    Dispatcher Engine Threads Specify the total number of threads allocated to process engine dispatcher messages. Engine dispatcher messages are generated whenever an activity must be processed asynchronously. If most of the processes deployed are durable with a large number of dehydration points (midprocess receive, onMessage, onAlarm, and wait activities), greater performance may be achieved by increasing the number of dispatcher engine threads. Note that higher thread counts can cause greater CPU utilization due to higher context-switching costs. The default value is 30 threads. Any value less than 1 thread is changed to the default.
    Payload Validation Select to enable validation of inbound and outbound messages. Nonschema-compliant payload data is intercepted and displayed as a fault. Note: This setting is independent of the SOA composite application and SOA Infrastructure payload validation level settings. If payload validation is enabled at both the service engine and SOA Infrastructure levels, data is checked twice: once when it enters the SOA Infrastructure, and again when it enters the service engine.
    Disable BPEL Monitors and Sensors Select this checkbox to disable all BPEL monitors and sensors defined for all BPEL components across all deployed SOA composite applications.
  3. Click Apply.
  4. If you want to configure advanced BPEL properties in the System MBean Browser, click More BPEL Configuration Properties. Properties that display include, but are not limited to, the following. Descriptions are provided for each property.
    • BpelcClasspath: The extra BPEL class path to include when compiling BPEL-generated Java sources.
    • DisableAsserts: Disables the execution of assertions in BPEL, including the bpelx:assert activity.
    • DisableSensors: Disables all calls to sensors.
    • ExpirationMaxRetry: The maximum number of times a failed expiration call (wait/onAlarm) is retried before failing.
    • ExpirationRetryDelay: The delay between expiration retries.
    • InstanceKeyBlockSize: The size of the block of instance IDs to allocate from the dehydration store during each fetch.
    • MaximumNumberOfInvokeMessagesInCache: The number of invoke messages stored in in-memory cache.
    • MaxRecoverAttempt: The number of automatic recovery attempts to submit in the same recoverable instance.
    • OneWayDeliveryPolicy: Changes whether one-way invocation messages are delivered.
    • StatsLastN: The size of the most recently processed request list.
    • SyncMaxWaitTime: The maximum time a request and response operation takes before timing out.
  5. Make changes appropriate to your environment.

Dehydration Store Monitoring

Dehydration Store Monitoring

The dehydration store monitoring feature allows you to see the performance of the database instance relevant to the SOA Infrastructure. Using this data, the SOA administrator can identify problems that are causing the performance bottleneck.

Setting Up and Viewing the Dehydration Diagnostics Data

Before you can view the dehydration diagnostics data, ensure that:
  • The database has been configured and is available as a target in Enterprise Manager.
  • The SOA Repository properties have been specified in the Monitoring Configuration page.
To view the dehydration diagnostics data, follow these steps:
  1. Log into Enterprise Manager Cloud Control.
  2. Click a SOA Infrastructure target on the Middleware page.
  3. In the SOA Infrastructure Home page, click the Dehydration Store tab.
  4. The following details area displayed:
    • Throughput indicators that provide details of the general health of the database instance.
    • Wait bottleneck issues related to the CPU, I/O, and Wait events.
    • Tablespace utilization for the SOA schema.
    • Performance data recorded by the ASH.
    • Key SOA tables and tablespace details related to the SOA schema.

WebLogic 12c & SOA 12c

The road ahead for WebLogic 12c

Before we can describe all the new features of WebLogic 12.1.3 & 12.1.4 and compare this to the 12.1.2 version we should first take a look at the 10.3.6 version. WebLogic 10.3.6 is still the latest 11g version but Oracle will support 10.3.6 till 2018 and extended support till 2021. So Oracle’s Fusion Apps and we have enough time to migrate to WebLogic 12.1.X. Oracle also promised that the upgrade should be easy.  That being said we can take look at the WebLogic 12.1.X features.

Last summer Oracle already released WebLogic 12.1.2 which has since WebLogic 12.1.1 been certified for Java EE 6 and it looks like the Java EE 7 certification is still far away, so Oracle updated the 12.1.2 version with some badly needed frameworks like WebSockets. To make the developer experience more complete Oracle added more support for Maven and it comes with a utility to synchronize a Maven repository with all the needed WebLogic libraries.

12.1.2 is also the first release, which comes with Fusion Middleware infrastructure components. For now FMW 12.1.2 contains ADF & OWSM and comes with Enterprise Manager & MDS.
WebLogic 12.1.2 replaced the BEA installer and the BSU patching utilities with the Oracle Universal Installer and the OPatch utilities for applying patches.  To make it even more easier it just comes in one taste ( no Java included or a specific Operating System installer ).  Just one big jar file for WebLogic with Coherence or one for WebLogic, Coherence and FMW.

WebLogic 12.1.2 introduced Dynamic Clusters, Elastic JMS and integrated Coherence configuration and management. Dynamic Clusters is a great feature to extend the WebLogic Cluster with Managed Servers based on a Server Template. For this we only need to change a parameter on the cluster and the new Managed Servers are distributed over the NodeManagers. To use this feature your blades need to have enough free resources to handle the extra Managed Servers.
Elastic JMS can be combined with Dynamic Clusters, this way we only need to create 1 JMS server, target this to the cluster and every Cluster node will have its own JMS server.

When we look at the announced features of WebLogic 12.1.3 and 12.1.4 we can see that Oracle continues on this road.


WebLogic 12.1.3 will be the first version for many FMW 12c products like Oracle SOA Suite 12c and probably come in one big jar. 12.1.3 & 12.1.4 will add extra features and improvements to Elastic JMS & Dynamic Clusters. Elastic JMS in 12.1.3 will support Server Migration so you can’t lose any JMS messages.
In 12.1.4, Dynamic Clusters will have support for auto-scaling based on thresholds based on user-defined metrics. WebLogic 12.1.4 will also have an API to control the Dynamic Clusters, this way we can easily program when to stop, start or remove nodes from a dynamic cluster.


WebLogic 12.1.3 will come with the JDBC 12c driver, this driver will gives us better integration and reliability between WebLogic 12c and Oracle Database 12c (Application Continuity).
When we take a look at the administration side of WebLogic we can see that the Enterprise Manager will be more important, in WebLogic 12.1.3 we can also do Application and JMS administration from the EM application. Also 12.1.3 will contain a Restful management APIs for additional monitoring, operations, Datasource and deployment support.  Plus a global OWSM policy to protect all your Web and Rest services with one server policy.

WebLogic 12.1.4 will have a new feature called Multi-Tenant Applications, this way you can define an WebLogic template for an application, so one or more customers of this application which will have its own Cluster, Managed Servers, Application and (not shared) resources plus it will support Oracle Database 12c pluggable databases.


The last part of this article will talk about the development side of WebLogic 12.1.3 and 12.1.4.  First WebLogic 12.1.3 has to be the Modern Development Platform and will focus on HTML5 development.


12.1.3 has some great new features like
Updated version of JAX-RS and WebSockets.
Server-Sent Events, this allows you to continuously sending updates to the browsers.
JSON-P or JSON with Padding will solve your cross domain security problems.
Maven improvements.
Avatar allows you to develop and deploy server side Javascript Services without knowing Java.

WebLogic 12.1.4 will be certified for Java EE 7 and this means the WebLogic platform will get some framework updates and some new frameworks like
Java API for JSON 1.0
Java API for WebSocket 1.0
Batch Applications 1.0
Concurrency Utilities 1.0


The last question is off course when can we expect WebLogic 12.1.3 & 12.1.4.  The 12.1.3 version will probably be released in March or April and 12.1.4 will be much later.

Monday, February 17, 2014

Weblogic Domain Creation


Weblogic Domain Creation:

Platform Installation of the Oracle Weblogic 10.3.6.0 completed.


Next we are going to create new Domain in Oracle weblogic.

The following domain creation particularly in Windows

 Step 1 

 Determine the appropriate domain creation mode for your situation. The domain creations are in below modes:  
                    
Graphical mode, console mode, silent mode.

At present we are going to see Graphical Mode installation.

Step 2

Navigate to path Local drive (E:) \ Oracle \ Middleware \ wlserver_10.3 \ Common \ bin

Step 3 

Double click on the Config.cmd file.


Step 4

Welcome window display to create a new weblogic domain and click next.


Step 5

Select Domain source window displays automatically generate a domain configuration and Click Next.


Step 6

Domain Name and Location windows displays.

Make the domain name as you like Eg : Sample_Domain, Test_Domain .

Default Location for the doamin creation is Local Drive (E:) \Oracle \ Middleware \ user_projects \ domain.

Click Next.


Step 7

Configure Administrator user Name and Password window displays.

Name: weblogic
Password: “As you like” eg : welcome1
Confirmation password: welcome1

Click Next.


Step 8

Configure Server start Mode and Jdk window display.

We need to select either Development mode or Production mode and click next.

Development mode:

The default JDK for development domain is Sun Hotspot
You can use the demo certificates for SSL
Auto deployment is enabled
Server instances rotate their log files on startup
Admin Server uses an automatically created boot.properties during startup
The default maximum capacity for JDBC Datasource is 15


Production mode:

The default JDK for production domain is JRockit
If you use the demo certificates for SSL a warning is displayed
Auto deployment is disabled
Server instances rotate their log files when it reaches 5MB
Admin Server prompts for username and password during startup
The default maximum capacity for JDBC Datasource is 25


Step 9

We can create Administration sever, Managed server, Cluster and Machine simultaneously, while creating domain.

Mark tick in the check box. Click next.


Step 10

Creation of Administration server.

Default port for Admin server is 7001, we can also change the Listen port.  Click Next


Step 11

Creation of Managed server.

Server Name: ms1

Needs to change the Listen port as 7003 and each managed server have unique Listen port and click next


Step 12 

Creation of Machine.

Machine Name : m1

Default Node manager Listen port is 5556. Click next


Step 13

Assigning managed servers to Machine.

So in this step managed server(ms1) is under machine(m1).

Click next.


Step 14

New domain creation structure and click create.


Step 15

New Domain creation is in progress. After reached 100% mark the check box [start Admin server]

The admin server will start. Finally click done. 


Domain has been created successfully.

Weblogic Console Admin URL : http://localhost:7001/console

Wednesday, February 5, 2014

How to Tune Java Garbage Collection

Is GC Tuning Required?

Or more precisely is GC tuning required for Java-based services? I should say GC tuning is not always required for all Java-based services. This means a Java-based system in operation has the following options and actions:
  • The memory size has been specified using -Xms and –Xmx options.
  • The -server option is included.
  • Logs such as Timeout log are not left in the system.
In other words, if you have not set the memory size and too many Timeout logs are printed, you need to perform GC tuning on your system.
But, there is one thing to keep in mind: GC tuning is the last task to be done.
Think about the fundamental cause of GC tuning. The Garbage Collector clears an object created in Java. The number of objects necessary to be cleared by the garbage collector as well as the number of GCs to be executed depend on the number of objects which have been created. Therefore, to control the GC performed by your system, you should, first, decrease the number of objects created.
There is a saying, "many a little makes a mickle." We need to take care of small things, or they will add up and become something big which is difficult to manage.
  • We need to use and make StringBuilder or StringBuffer a way of life instead of String.
  • And it is better to accumulate as few logs as possible.
However, we know that there are some cases we cannot help. We have seen that XML and JSON parsing use the most memory. Even though we use String as little as possible and process logs as well as we can, a huge temporary memory is used for parsing XML or JSON, some 10-100 MB. However, it is difficult not to use XML and JSON. Just understand that it takes too much memory.
If application memory usage improves after repeated tunings, you can start GC tuning. I classify the purposes of GC tuning into two.
  1. One is to minimize the number of objects passed to the old area;
  2. and the other is to decrease Full GC execution time.

Minimizing Number of Objects Passed to Old Area

Generational GC is the GC provided by Oracle JVM, excluding the G1 GC which can be used from JDK 7 and higher versions. In other words, an object is created in the Eden area and transferred from and to the Survivor area. After that, the objects left are sent to the Old area. Some objects are created in the Eden area and directly passed to the Old area because of their large size. GC in the Old area takes relatively more time than the GC in the New area. Therefore, decreasing the number of objects passed to the Old area can decrease the full GC in frequency. Decreasing the number of objects passed to the Old area may be misunderstood as choosing to leave the object in the New area. However, this is impossible. Instead, you can adjust the size of the New area.

Decreasing Full GC Time

The execution time of Full GC is relatively longer than that of Minor GC. Therefore, if it takes too much time to execute Full GC (1 second or more), timeout may occur in several connected parts.
  • If you try to decrease the Old area size to decrease Full GC execution time, OutOfMemoryError may occur or the number of Full GCs may increase.
  • Alternatively, if you try to decrease the number of Full GC by increasing the Old area size, the execution time will be increased.
Therefore, you need to set the Old area size to a "proper" value.

Options Affecting the GC Performance

As I have mentioned at the end of Understanding Java Garbage Collection, do not think that "Somebody's got a great performance when he used GC options. Why don't we use that option as he did?" The reason is that the size of objects created and their lifetime is different from one Web service to another.
Simply consider, if a task is performed under the conditions of A, B, C, D and E, and the same task is performed under the conditions of only A and B, then which one will be done quicker? From a common-sense standpoint, the answer would be the task which is performed under conditions of A and B.
Java GC options are the same. Setting several options does not enhance the speed of executing GC. Rather, it may make it slower. The basic principle of GC tuning is to apply the different GC options to two or more servers and compare them, and then add those options to the server for which the server has demonstrated enhanced performance or better GC time. Keep this in mind.
The following table shows options related to memory size among the GC options that can affect performance.
Table 1: JVM Options to Be Checked for GC Tuning.
ClassificationOptionDescription
Heap area size-XmsHeap area size when starting JVM
-XmxMaximum heap area size
New area size-XX:NewRatioRatio of New area and Old area

-XX:NewSizeNew area size

-XX:SurvivorRatioRatio of Eden area and Survivor area
I frequently use -Xms, -Xmx, and -XX:NewRatio options for GC tuning.  -Xms and -Xmx option are particularly required. How you set the NewRatio option makes a significant difference on GC performance.
Some people ask how to set the Perm area size? You can set the Perm area size with the -XX:PermSize and -XX:MaxPermSize options but only when OutOfMemoryError occurs and the cause is the Perm area size.
Another option that may affect the GC performance is the GC type. The following table shows available options by GC type (based on JDK 6.0).
Table 2: Available Options by GC Type.
Classification Option Remarks
Serial GC -XX:+UseSerialGC
Parallel GC -XX:+UseParallelGC
-XX:ParallelGCThreads=value

Parallel Compacting GC -XX:+UseParallelOldGC
CMS GC -XX:+UseConcMarkSweepGC
-XX:+UseParNewGC
-XX:+CMSParallelRemarkEnabled
-XX:CMSInitiatingOccupancyFraction=value
-XX:+UseCMSInitiatingOccupancyOnly

G1 -XX:+UnlockExperimentalVMOptions
-XX:+UseG1GC
In JDK 6, these two options must be used together.
Except G1 GC, the GC type is changed by setting the option at the first line of each GC type. The most general GC type that does not intrude is Serial GC. It is optimized for client systems.
There are a lot of options that affect GC performance. But you can get significant effect by setting the options mentioned above. Remember that setting too many options does not promise enhanced GC execution time.

Procedure of GC Tuning

The procedure of GC tuning is similar to the general performance improvement procedure. The following is the GC tuning procedure that I use.

1. Monitoring GC status

You need to monitor the GC status to check the GC status of the system in operation. Please see various GC monitoring methods in How to Monitor Java Garbage Collection.

2. Deciding whether to tune GC after analyzing the monitoring result

After checking the GC status, you should analyze the monitoring result and decide whether to tune GC or not. If the analysis shows that the time taken to execute GC is just 0.1-0.3 seconds. you don't need to waste your time on tuning the GC. However, if the GC execution time is 1-3 seconds, or more than 10 seconds, GC tuning is necessary.
But, if you have allocated about 10GB Java memory and it is impossible to decrease the memory size, there is no way to tune GC. Before tuning GC, you need to think about why you need to allocate large memory size. If you have allocated the memory of 1 GB or 2 GB and OutOfMemoryError occurs, you should execute heap dump to verify and remove the cause.
Note:
Heap dump is a file of the memory that is used to check the objects and data in the Java memory. This file can be created by using the jmap command included in the JDK. While creating the file, the Java process stops. Therefore, do not create this file while the system is operating.
Search on the Internet the detailed description on heap dump. For Korean readers, see my book I published last year: The story of troubleshooting for Java developers and system operators (Sangmin Lee, Hanbit Media, 2011, 416 pages).

3. Setting GC type/memory size

If you have decided on GC tuning, select the GC type and set the memory size. At this time, if you have several servers, it is important to check the difference of each GC option by setting different GC options for each server.

4. Analyzing results

Start analyzing the results after collecting data for at least 24 hours after setting GC options. If you are lucky, you will find the most suitable GC options for the system. If you are not, you should analyze the logs and check how the memory has been allocated. Then you need to find the optimum options for the system by changing the GC type/memory size.

5. If the result is satisfactory, apply the option to all servers and terminate GC tuning.

If the GC tuning result is satisfactory, apply the option to all the servers and terminate GC tuning.
In the following section, you will see the tasks to be done in each stage.

Monitoring GC Status and Analyzing Results

The best way to check the GC status of the Web Application Server (WAS) in operation is to use the jstat command. I have explained the jstat command in How To Monitor Java Garbage Collection, so I will describe the data to check in this article.
The following example shows a JVM for which GC tuning has not been done (however, it is not the operation server).
1
2
3
4
$ jstat -gcutil 21719 1s
S0    S1    E    O    P    YGC    YGCT    FGC    FGCT GCT
48.66 0.00 48.10 49.70 77.45 3428 172.623 3 59.050 231.673
48.66 0.00 48.10 49.70 77.45 3428 172.623 3 59.050 231.673
Here, check the values of YGC and YGCT. Divide YGCT by YGC. Then you get 0.050 seconds (50 ms). It means that it takes average 50 ms to execute GC in the Young area. With that result, you don't need to care about GC for the Young area.
And now, check the values of FGCT and FGC. Divide FGCT by FGC. Then you get 19.68 seconds. It means that it takes average 19.68 seconds to execute GC. It may take 19.68 seconds to execute GC three times. Otherwise, it takes 1 second to execute GC two times and 58 seconds for once. In both cases, GC tuning is required.
You can easily check GC status by using the jstat command; however, the best way to analyze GC is by generating logs with the –verbosegc option. For a detailed description on how to generate and tools to analyze logs, I have explained it the previous article. HPJMeter is my favorite among tools that are used to analyze the -verbosegc log. It is easy to use and analyze. With HPJmeter you can easily check the distribution of GC execution times and the frequency of GC occurrence.
If the GC execution time meets all of the following conditions, GC tuning is not required.
  • Minor GC is processed quickly (within 50 ms).
  • Minor GC is not frequently executed (about 10 seconds).
  • Full GC is processed quickly (within 1 second).
  • Full GC is not frequently executed (once per 10 minutes).
The values in parentheses are not the absolute values; they vary according to the service status. Some services may be satisfied with 0.9 seconds of Full GC processing speed, but some may not. Therefore, check the values and decide whether to execute GC tuning or not by considering each service.
There is one thing you should be careful of when you check the GC status; do not check the time of Minor GC and Full GC only. You must check the number of GC executions, as well. If the New area size is too small, Minor GC will be too frequently executed (sometimes once or more per 1 second). In addition, the number of objects passed to the Old area increases, causing increased Full GC executions. Therefore, apply the –gccapacity option in the stat command to check how much the area is occupied.

Setting GC Type/Memory Size

Setting GC Type

There are five GC types for Oracle JVM. However, if not JDK 7, one among Parallel GC, Parallel Compacting GC and CMS GC should be selected. There is no principle or rule to decide which one to select.
If so, how can we select one? The most recommended way is to apply all three. However, one thing is clear - CMS GC is faster than other Parallel GCs. At this time, if so, just apply CMS GC. However, CMS GC is not always faster. Generally, Full GC of CMS GC is fast, however, when concurrent mode failure occurs, it is slower than other Parallel GCs.

Concurrent mode failure

Let's take a deeper look into the concurrent mode failure.
The biggest difference between Parallel GC and CMS GC is the compaction task. The compaction task is to remove memory fragmentation by compacting memory in order to remove the empty space between allocated memory areas.
In the Parallel GC type, the compaction is executed whenever Full GC is executed, taking too much time. However, after executing Full GC, memory can be allocated in a faster way since the next memory can be allocated sequentially.
On the contrary, CMS GC does not accompany compaction. Therefore, the CMS GC is executed faster. However, when compaction is not executed, some empty spaces are generated in the memory as before executing Disk Defragmenter. Therefore, there may be no space for large objects. For example, 300 MB is left in the Old area, but some 10 MB objects cannot be sequentially saved in the area. In this case, "Concurrent mode failure" warning occurs and compaction is executed. However, if CMS GC is used, it takes a longer time to execute compaction than other Parallel GCs. And, it may cause another problem. For a more detailed description on concurrent mode failure, see Understanding CMS GC Logs, written by Oracle engineers.
In conclusion, you should find the best GC type for your system.
Each system requires its proper GC type, so you need to find the best GC type for your system. If you are running six servers, I recommend you to set the same options for each of two servers, add the -verbosegc option, and then analyze the result.

Setting Memory Size

The following shows the relationship between the memory size, the number of GC execution, and the GC execution time.
  • Large memory size
    • decreases the number of GC executions.
    • increases the GC execution time.
  • Small memory size
    • decreases the GC execution time.
    • increases the number of GC executions.
There is no "right" answer to set the memory size to small or large. 10 GB is OK if the server resource is good and Full GC can be completed within 1 second even when the memory has been set to 10 GB. But most servers are not in the status. When the memory is set to 10 GB, it takes about 10 ~ 30 seconds to execute Full GC. Of course, the time may vary according the object size.
If so, how we should set the memory size? Generally, I recommend 500 MB. But note that it does not mean that you should set the WAS memory with the –Xms500m and –Xmx500m options. Based on the current status before GC tuning, check the memory size left after Full GC. If there is about 300 MB left after Full GC, it is good to set the memory to 1 GB (300 MB (for default usage) + 500 MB (minimum for the Old area) + 200 MB (for free memory)). That means you should set the memory space with more than 500 MB for the Old area. Therefore, if you have three operation servers, set one server to 1 GB, one to 1.5 GB, and one to 2 GB, and then check the result.
Theoretically, GC will be done fast in the order of 1 GB > 1.5 GB > 2 GB, so 1 GB will be the fastest to execute GC. However, it cannot be guaranteed that it takes 1 second to execute Full GC with 1 GB and 2 seconds with 2 GB. The time depends on the server performance and the object size. Therefore, the best way to create the measurement data is to set as many as possible and monitor them.
You should set one more thing for setting the memory size: NewRatio. NewRatio is the ratio of the New area and the Old area. If XX:NewRatio=1, New area:Old area is 1:1. For 1 GB, New area:Old area is 500MB: 500MB. If NewRatio is 2, New area:Old area is 1:2. Therefore, as the value gets larger, the Old area size gets larger and the New area size gets smaller.
It may not be an important thing, but NewRatio value significantly affects the entire GC performance. If the New area size is small, much memory is passed to the Old area, causing frequent Full GC and taking a long time to handle it.
You may simply think that NewRatio 1 would be the best; however, it may not be so. When NewRatio is set to 2 or 3, the entire GC status may be better. And I have seen such cases.
What is the fastest way to complete GC tuning? Comparing the results from performance tests is the fastest way to get the result. To set different options for each server and monitor the status, it is recommended to check the data after at least one or two days. However, you should prepare for giving the same load with the operation situation when you execute GC tuning through performance test. And the request ratio such as the URL that gives the load must be identical to that of the operation situation. However, giving accurate load is not easy for the professional performance tester and takes too long time for preparing. Therefore, it is more convenient and easier to apply the options to operation and wait for the result even though it takes a longer time.

Analyzing GC Tuning Results

After applying the GC option and setting the -verbosegc option, check whether the logs are accumulated as desired with the tail command. If the option is not exactly set and no log is accumulated, you will waste your time. If logs are accumulated as desired, check the result after collecting data for one or two days. The easiest way is to move logs to the local PC and analyze the data by using HPJMeter.
In the analysis, focus on the following. The priority is determined by me. The most important item to decide the GC option is Full GC execution time.
  • Full GC execution time
  • Minor GC execution time
  • Full GC execution interval
  • Minor GC execution interval
  • Entire Full GC execution time
  • Entire Minor GC execution time
  • Entire GC execution time
  • Full GC execution times
  • Minor GC execution timesl
It is a very lucky case to find the most appropriate GC option, and in most cases, it's not. Be careful when executing GC tuning because OutOfMemoryError may occur if you try to complete GC tuning all at once.

Examples of Tuning

So far, we have theoretically discussed GC tuning without any examples. Now we will take a look at the examples of GC tuning.

Example 1

The following example is GC tuning for Service S. For the newly developed Service S, it took too much time to execute Full GC.
See the result of jstat –gcutil.
1
2
S0 S1 E O P YGC YGCT FGC FGCT GCT
12.16 0.00 5.18 63.78 20.32 54 2.047 5 6.946 8.993
Information to the left Perm area is not important for the initial GC tuning. At this time, the values from the right YGC are important.
The average value taken to execute Minor GC and Full GC once is calculated as below.
Table 3: Average Time Taken to Execute Minor GC and Full GC for Service S.
GC Type GC Execution Times GC Execution Time Average
Minor GC 54 2.047 37 s
Full GC 5 6.946 1,389 ms
37 ms is not bad for Minor GC. However, 1.389 seconds for Full GC means that timeout may frequently occur when GC occurs in the system of which DB Timeout is set to 1 second. In this case, the system requires GC tuning.
First, you should check how the memory is used before starting GC tuning. Use the jstat –gccapacity option to check the memory usage. The result checked from this server is as follows.
1
2
NGCMN NGCMX NGC S0C S1C EC OGCMN OGCMX OGC OC PGCMN PGCMX PGC PC YGC FGC
212992.0 212992.0 212992.0 21248.0 21248.0 170496.0 1884160.0 1884160.0 1884160.0 1884160.0 262144.0 262144.0 262144.0 262144.0 54 5
The key values are as follows.
  • New area usage size: 212,992 KB
  • Old area usage size: 1,884,160 KB
Therefore, the totally allocated memory size is 2 GB, excluding the Perm area, and New area:Old area is 1:9. To check the status in a more detailed way than jstat, the -verbosegc log has been added and three options were set for the three instances as shown below. No other option has been added.
  • NewRatio=2
  • NewRatio=3
  • NewRatio=4
After one day, the GC log of the system has been checked. Fortunately, no Full GC has occurred in this system after NewRatio has been set.
Why? The reason is that most of the objects created from the system are destroyed soon, so the objects are not passed to the Old area but destroyed in the New area.
In this status, it is not necessary to change other options. Just select the best value for NewRatio. So, how can we determine the best value? To get it, analyze the average response time of Minor GC for each NewRatio.
The average response time of Minor GC for each option is as follows:
  • NewRatio=2: 45 ms
  • NewRatio=3: 34 ms
  • NewRatio=4: 30 ms
We have concluded that NewRatio=4 is the best option since the GC time is the shortest even though the New area size is the smallest. After applying the GC option, the server has no Full GC.
For your information, the following is the result of executing jstat –gcutil some days after the JVM of the service had started.
1
2
S0 S1 E O P YGC YGCT FGC FGCT GCT
8.61 0.00 30.67 24.62 22.38 2424 30.219 0 0.000 30.219
You many think that GC has not frequently occurred since the server has few requests. However, Full GC has not been executed while Minor GC has been executed 2,424 times.

Example 2

This example is for Service A. We found that the JVM had not operated for a long time (8 seconds or more) periodically in the Application Performance Manager (APM) in the company. So we executed GC tuning. We were searching for the reason and found that it took a long time to execute Full GC, so we decided to execute GC tuning.
As the starting stage of GC tuning, we added the -verbosegc option and the result is as follows.
duration_graph_before_gc_tuning.jpeg
Figure 1: Duration Graph before GC Tuning.
The above graph, which shows the duration, is one of the graphs that the HPJMeter automatically provides after analysis. The X-axis shows the time after the JVM has started and the Y-axis shows the response time of each GC. The green dots, the CMS, indicates the Full GC result, and the blue bots, Parallel Scavenge, indicates the Minor GC result.
Previous I said that CMS GC would be the fastest. But the above result show that there were some cases which took up to 15 seconds. What has caused such result? Please remember what I said before: CMS gets slower when compaction is executed. In addition, the memory of the service has been set by using –Xms1g and –Xmx4g and the memory allocated was 4 GB.
So I changed the GC type from CMS GC to Parallel GC. I changed the memory size to 2 GB and then set the NewRatio to 3. The result of jstat –gcutil after a few hours is as follows.
1
2
S0 S1 E O P YGC YGCT FGC FGCT GCT
0.00 30.48 3.31 26.54 37.01 226 11.131 4 11.758 22.890
The Full GC time was faster, 3 seconds per one time, compared to 15 seconds for 4 GB. However, 3 seconds is still not so fast. So I created six cases as follows.
  • Case 1: -XX:+UseParallelGC -Xms1536m -Xmx1536m -XX:NewRatio=2
  • Case 2: -XX:+UseParallelGC -Xms1536m -Xmx1536m -XX:NewRatio=3
  • Case 3: -XX:+UseParallelGC -Xms1g -Xmx1g -XX:NewRatio=3
  • Case 4: -XX:+UseParallelOldGC -Xms1536m -Xmx1536m -XX:NewRatio=2
  • Case 5: -XX:+UseParallelOldGC -Xms1536m -Xmx1536m -XX:NewRatio=3
  • Case 6: -XX:+UseParallelOldGC -Xms1g -Xmx1g -XX:NewRatio=3
Which one would be the fastest? The result showed that the smaller the memory size was, the better the result was. The following figure shows the duration graph of Case 6, which showed the highest GC improvement. The slowest response time was 1.7 seconds and the average had been changed to within 1 second, showing the improved result.
duration_graph_after_applying_case_6.png
Figure 2: Duration Graph after Applying Case 6.
With the result, I changed all GC options of the service to Case 6. However, this change causes OutOfMemoryError at night each day. It is difficult to detail the reason here, but in short, batch data processing made a lack of JVM memory. The related problems are being cleared now.
It is very dangerous to analyze the GC logs accumulated for a short time and to apply the result to all servers as executing GC tuning. Keep in mind that GC tuning can be executed without failure only when you analyze the service operation as well as the GC logs.
We have reviewed two GC tuning examples to see how GC tuning is executed. As I mentioned, the GC option set in the examples can be identically set for the server which has the same CPU, OS version and JDK version with the service that executes the same functions. However, do not apply the option I did to your services in operation, since they may not work for you.

Conclusion

I execute GC tuning based on my experiences without executing heap dump and analyzing the memory in detail. Precise memory status analysis may draw the better GC tuning results. However, that kind of analysis may be helpful when the memory is used in the constant and routine pattern. But, if the service is heavily used and there are a lot of memory usage patterns, GC tuning based on reliable previous experience may be recommendable.
I have executed the performance test by setting the G1 GC option to some servers, but have not applied to any operation server yet. The G1 GC option shows a faster result than any other GC types. However, it requires to upgrade to JDK 7. In addition, stability is still not guaranteed. Nobody knows if there is any critical bug or not. So the time is not yet ripe for applying the option.
After JDK 7 is stabilized (this does not mean that it is not stable) and WAS is optimized for JDK 7, enabling stable application of G1 GC may finally work as expected and some day we may not need the GC tuning